Overview
Visual Studio 2017 introduces a wealth of features and enhancements designed to significantly improve the productivity of developers. Many of these improvements focus on saving time and effort on everyday tasks, such as code navigation, IntelliSense, refactoring, code fixes, and debugging. In this lab, we’ll take a quick tour of some of the many benefits.
There are also a wealth of new features and enhancements in Visual Studio 2017 covered in other labs. Be sure to check out hands-on labs on topics such as Azure, Git, EditorConfig, Live Unit Testing, Live Architecture Dependency Validation, and more. In addition, there has been a significant investment in performance throughout the IDE, ranging from faster startup times and lightweight solution load to improved performance in everyday features.
For a more exhaustive list of what’s new in Visual Studio 2017, please check out the release notes.
Prerequisites
In order to complete this lab you will need the Visual Studio 2017 virtual machine provided by Microsoft. Click the button below to launch the virtual machine on the Microsoft Hands-on-Labs portal.
Alternatively, you can download the virtual machine from here
Exercise 1: Developer experience enhancements in Visual Studio 2017
Task 1: Working with the new modular installer
-
Log in as Sachin Raj (VSALM\Sachin). All user passwords are P2ssw0rd.
-
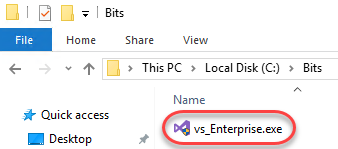
Open Windows Explorer and navigate to C:\Bits. Double-click the VS installer to launch it.
-
If asked to update the installer, do so.
-
Accept the terms to continue.

-
After accepting the terms, the installer may offer to update Visual Studio. Click Cancel to skip this. While updates are now really fast, they’re not the focus of this lab.

-
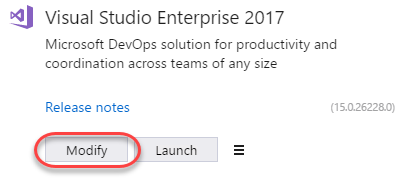
Click Modify. Note that if there are updates available, the Modify option may be in the hamburger menu next to Launch.
-
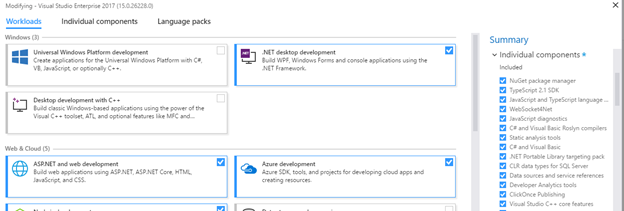
The new lightweight and componentized installer breaks down Visual Studio into independent workloads that lets you install just what you need, helping you get going much faster. Some workloads have already been installed on the VM, such as .NET desktop development and Web development. Selecting these workloads ensured that the installer would set up everything needed to perform the task associated with those types of development, which you can view in the Summary | Individual components section on the right side.
-
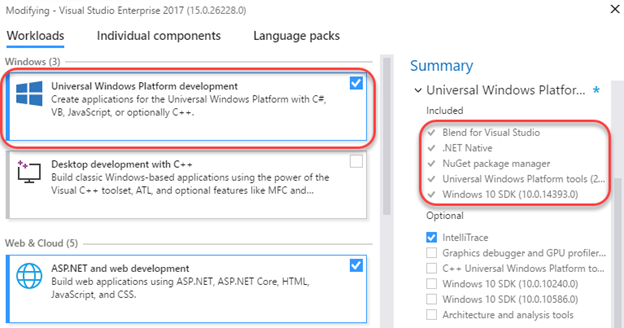
However, let’s say that your role has changed and you’re now also working on Universal Windows Platform apps. Click that workload and Visual Studio will calculate what needs to be set up (along with offering optional components).
-
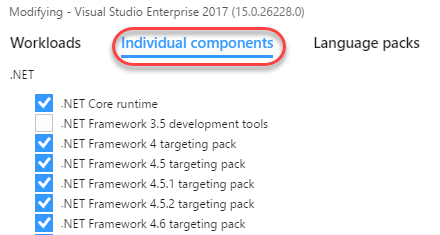
Of course you can still select individual components to install, regardless of selected workflow. Select the Individual components tab to see a flat list of all the tools, features, and SDKs available.
-
Close all installer windows.
Task 2: Boosting your productivity
-
Launch Visual Studio from the taskbar.
-
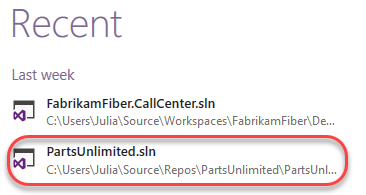
Open the PartsUnlimited.sln solution from the Start Page.
-
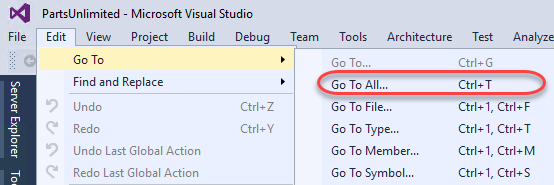
Navigate To has been completely overhauled and renamed Go To All. From the main menu, select Edit | Go To and select Go To All.
-
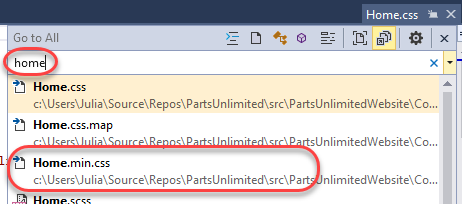
Go To All consolidates the search experience across project assets and offers easy filtering. Type “home” and select different results from the list. Each will open in the temporary editor slot so that you can preview the file contents.
-
Select the Types filter. This adds a “t” to the front of the query, indicating that you want to filter by types. You can also manually type that filter yourself in the future to save time. Click HomeController and press Enter to open it in a permanent slot.
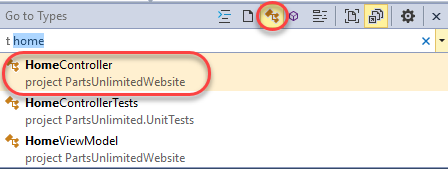
-
Press Ctrl+T to reopen Go To All. Type ”:” (a colon) to filter the query to Go To Line. Note that there is a tip provided to let you know what input is valid here, such as 1-127 due to the number of lines in the file.

-
Finish the search by completing ”: 33” and clicking the line result provided.

-
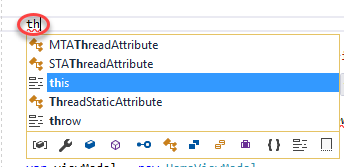
Make a new line in the source at line 33 and type “th”. As expected, IntelliSense will jump in with a set of suggestions. IntelliSense now makes exploring a new API faster by allowing you to narrow down the set of values by category using the filters at the bottom of the window. This means that if it’s a variable you need, you don’t need to wade through lots of types to get to it. It’s also more intuitive about parameters and will default to the option it thinks is best when possible. Plus, IntelliSense supports dozens of programming languages out of the box.
-
Complete typing “this.GT”. IntelliSense also recognizes capital letters as shorthand and will refine results based on the available options that fit the typed pattern. In this case there are two valid options for “this” that have capital G followed by a capital T later in their name, which it highlights in the autocomplete suggestions. Select GetTopSellingProducts to complete the code.

-
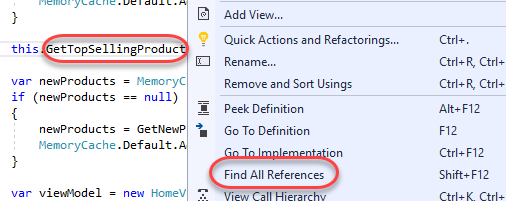
Find All References has also gotten a makeover in Visual Studio 2017. Right-click GetTopSellingProducts and select Find All References.
-
The results window is now much more modern with grouping and color. You can change the way references are grouped, as well as use the Keep Results button to have multiple Find All References result set panels.

-
Hovering over the code of one of the results even provides a peek preview so that you understand the context of the reference without having to open it.

-
Remove the partial line of code (“this.GetTopSellingProducts”) you just added in the previous steps.
-
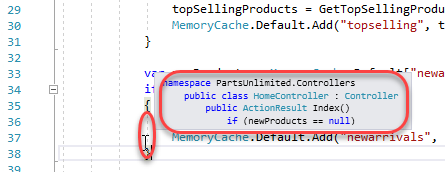
Notice the indent guides (dashed vertical lines) to the left of the code within the editor. These lines connect indent points to make it easier to track the structure of your code. Mouse over one of the lines to see a tooltip showing the indent structure the code is scoped to.
-
Set a breakpoint at the instantiation of newProducts (around line 33) by clicking the grey bar to its left.

-
Press F5 to launch the site in debug mode. Wait until the breakpoint hits.
-
One of the nifty new features in the debugging experience is the ability to Run to Click. Hover next to the line of code at line 40 and click the Run to Click button that appears. The debugger will now execute until it hits that line.

-
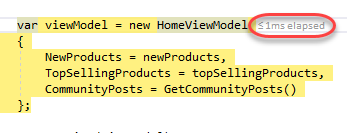
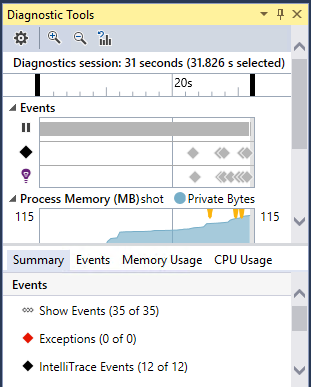
After the step, a PerfTip will appear next to the current line indicating how long it took to execute to get here. While this number is probably pretty low for this scenario, it might be much larger in others. If you click the PerfTip, it will bring you directly to the Diagnostic Tools so that you can start reviewing.
Task 3: Using the new Exception Helper
-
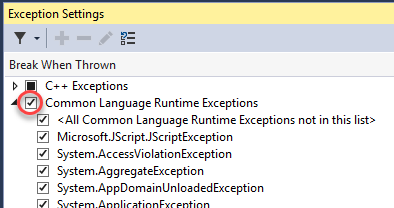
Press Alt+Ctrl+E to bring up the Exception Settings panel.
-
Check the Common Language Runtime Exceptions box to check all the child exceptions. This will ensure that Visual Studio breaks when any of them are encountered.
-
Press F5 to continue running the application.
-
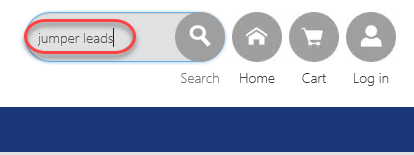
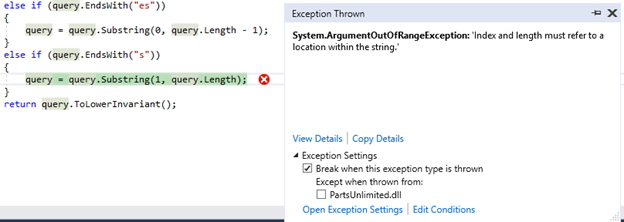
In Internet Explorer, search for “jumper leads”. This is a built-in error that will throw an exception.
-
When the exception is encountered, the new Exception Helper will cut right to the heart of the issue. It provides easy access to exception settings relevant for this exception, such as whether or not to break when it’s encountered. In addition, you can specify whether to exclude exceptions thrown from the current offending module. If the exception you break on has any inner exceptions, you can immediately see their details in the Exception Helper and use the arrows to navigate through the tree of inner exceptions.
-
Select Debug | Stop Debugging from the main menu to end the debug session.